Psicothema was founded in Asturias (northern Spain) in 1989, and is published jointly by the Psychology Faculty of the University of Oviedo and the Psychological Association of the Principality of Asturias (Colegio Oficial de Psicología del Principado de Asturias).
We currently publish four issues per year, which accounts for some 100 articles annually. We admit work from both the basic and applied research fields, and from all areas of Psychology, all manuscripts being anonymously reviewed prior to publication.

Psicothema, 2000. Vol. Vol. 12 (nº 4). 701-711
Guillermo Vallejo and J. Ramón Escudero
University of Oviedo
The aim of this paper is to evaluate the robustness of the Welch-James multivariate solution given by Johansen (1980), and the improved multivariate Brown-Forsythe (1974) procedure when covariance matrices are heterogeneous. The results indicate that when design is unbalanced and the data are multivariate normally distributed, both approaches show a good control of error rates for the within-subjects main effect. When normality and homogeneity assumptions are jointly violated, none of the procedures was able to control the error rates in all of the investigated conditions. With regard to the test of the interaction effect, our results indicate that the modified Brown-Forsythe procedure can effectively control the rate of Type I errors when dispersion matrices are heterogeneous, and also when the data are sampled from a skewed distribution. This finding held even when the degree of heterogeneity of the covariance matrices was varied across the design. The Welch-James test is not a adequate solution, since the sample sizes required to achieve robustness could be unreasonably large, particularly when the multivariate normality assumption is violated.
Un examen de la robustez de las pruebas Welch-James y Brown-Forsythe modificada en diseños multivariados split-plot. Mediante el presente trabajo se pretende evaluar la robustez de la solución multivariada Welch-James dada por Johansen (1980) y la versión mejorada del enfoque multivariado de Brown y Forsythe (1974) cuando las matrices de dispersión son heterogéneas. Los resultados indican que cuando el diseño es desequilibrado y los datos son extraídos desde una distribución normal ambos enfoques controlan adecuadamente las tasas de error asociadas con el efecto principal de las ocasiones de medida. Sin embargo, cuando se incumplen los supuestos de normalidad y homogeneidad, ningún procedimiento es capaz de proporcionar un control estricto de las tasas de error. Por lo que respecta a la interacción, los resultados ponen de relieve que el procedimiento modificado de Brown-Forsythe ejerce un control muy satisfactorio de las tasas de error cuando los datos se obtienen desde distribuciones sesgadas. Este resultado también se mantiene cuando se el grado de heterogeneidad de las matrices de covarianza se varia a lo largo del diseño. Bajo esta condición el procedimiento de Welch-James no constituye una solución adecuada, dado que los tamaños de muestra requeridos para lograr la robustez pueden llegar a ser exagerados, sobre manera, cuando los datos carecen de normalidad.

The univariate repeated measures design containing a single between-subjects (groups) factor A with j=1,...,p levels and nj observations at each j and a single within-subjects (occasions) factor B with k=1,...,q levels is very frequent in almost all scientific fields (Shoukri & Pause, 1999). Although the nature of these designs is typically multivariate, the effects of design (occasions main effect and groups x occasions interaction) can be tested by using univariate or multivariate approach. The validity of these procedures rests on the nature of the assumptions that the researcher is willing to make about the data. When the assumptions of multivariate normality, homogeneity of the covariance matrices, and multisample sphericity are satisfied, such designs are analyzed by Scheffé’s (1956) univariate mixed model. When the multisample sphericity assumption is not satisfied either an adjusted degrees of freedom univariate test or multivariate model perspective may be used. Under a multivariate model, no restrictions are placed on the structure of the covariance matrix. However, the number of experimental observations must be greater or equal to the of repeated measurements and, as the univariate model, the assumptions of dispersion matrix equality and normality must be satisfied.
If sphericity assumption is met, the conventional univariate procedure is more powerful than the multivariate approach (Davidson, 1972). However, if sphericity appears untenable no clear-cut rule emerged for choosing between the adjusted degrees of freedom univariate tests and their multivariate counterparts (Mendoza, Toothaker, & Nicewander, 1974). When covariance matrices are unequal and the design is balanced (equal group sizes), Keselman and Keselman (1990) have shown that both procedures are generally robust to the violation of dispersion matrix equality. In this case, the choice between univariate or multivariate technique depends, especially, on differences in their statistical power. However, none of these approaches can provide robust tests of within-subjects main and interaction effects when matrices are heterogeneous and group sizes are unequal. In this last situation, Algina and Oshima (1995) suggested using the General Approximation or Improved General Approximation test due to Huynh (1978), Keselman, Carriere, and Lix (1993) suggested using the multivariate Welch-James (WJ) statistic given by Johansen (1980), whereas Jones (1993) defends the mixed model approach. That is, rather than presuming a certain type of structure, as is the case with the univariate or a multivariate test statistic, the advocates the mixed model approach modeling the covariance structure directly. Yet, recently, Keselman, Algina, Kowalchuk and Wolfinger (1999) have found that this new approach, as implemented in SAS (Release 6.11 of PROC MIXED, SAS Institute, 1996), has some problems in identifying the correct structure, and, is times, it is prone to depressed or inflated Type I error rates. For this reason they suggest apply the approach cautiously, proposing as alternative solution the multivariate WJ statistic.
In a multivariate repeated measures experiment, each subject gives a r-dimensional response on each of q occasions. In this case, if the r variables are statistically related or if the Type I error rate is to be controlled experimentwise, either a multivariate mixed model (MMM; the Scheffé’s mixed model generalized for application to multivariate case) or doubly multivariate model (DMM) perspective may be used. Both analyses require (a) that the populations sampled have a multivariate normal distribution, and (b) that the dispersion matrices are the same for the populations sampled. Otherwise, the MMM analysis rests upon a further assumption, namely multivariate sphericity (M-sphericity). Simulation studies have shown that the unadjusted MMM test cannot be recommended except when M-sphericity is known to hold. One situation in which the adjusted MMM test is more powerful than the DMM test is when sample size is very small. If sample size is reasonably large, there appears to be little or no advantage in using adjusted MMM tests. When the sample contains adequate information to estimate the covariance matrix without requiring any particular structural form, the DMM test must be preferred since almost always provide greater statistical power (Boik, 1991; Vallejo & Menéndez, 1997; Vallejo, Fidalgo, & Fernández, 1998).
Vallejo, Fernández, Fidalgo, and Escudero (1999) evaluated the power and robustness for the DMM test and the ε-corrected MMM test suggested by Boik (1991) in the presence of heteroscedasticity of the variance-covariance matrices and when data were non-normal in form under null and non-null hypothesis. Their results revealed that these tests were extremely sensitive to departures from covariance homogeneity when the design was unbalanced (unequal group sizes) and the sample size was small. When the design was balanced, both adjusted MMM and MDM approaches exhibited a superior control of error rates. Data distribution had small effects on the Type I error rates and power for both procedures: the DMM test was slightly liberal when the model was additive and conservative when the model was non-additive; its effect for corrected MMM tests was insignificant. These results are consistent with the empirical literature (Keselman & Keselman, 1990; Keselman & Lix, 1997; Mendoza et al. 1974; Olson, 1974; Rogan, Keselman, & Mendoza, 1980).
Subsequently, Vallejo, Fidalgo and Fernández (in press) evaluated the robustness of the doubly multivariate model, Welch-James multivariate solution and the multivariate version of the modified Brown-Forsythe (BF, 1974) procedure proposed by Rubin (1983) and Mehrotra (1997), within the context of one-way analysis of variance. The performance of these procedures was investigated by testing within-blocks sources of variation in unbalanced multivariate split-plot designs containing unequal covariance matrices. Our findings indicate that the doubly multivariate model did not provide effective Type I error control, while the Welch-James procedure provided robust and powerful tests of the within-subjects main effect; however, this approach provided liberal tests of the interaction effect. The results also indicate that the modified Brown-Forsythe procedure provided robust tests of within-subjects main and interaction effects, especially when the design was balanced, or when group sizes and covariance matrices were positively paired.
Vallejo et al. (in press) did not consider the effects of multivariate non-normality on the operating characteristics of the examined procedures. Thus, additional research is necessary to determine if the findings obtained by Vallejo et al. (in press) can be generalized beyond the limited conditions they investigated. In particular, it is very important to examine the robustness of modified BF procedure when the degree of heterogeneity of the covariance matrices is varied across the designs and the data are not normally distributed. Accordingly, the main purpose of this study is to compare the Type I error rates of the WJ and modified BF statistics for testing within-subjects main and interaction effects in multivariate repeated measures designs, in the presence of heteroscedasticity variance-covariance matrices and multivariate non-normality. A second purpose of this study is to determine if the BF test offers a greater control of Type I error rates for the interaction than the WJ when the sample sizes are sufficiently large.
Definition of Test Statistics
The linear model for multivariate repeated measures can be written as
Y= XB + U, (1)
where Y is the N x qr response matrix, B is the p x qr matrix of parameters, X is the N x p design matrix of full rank, and U is the N x qr matrix of random errors. If ε’i denotes a vector of random errors associated with the ith subject, it is assumed that ε’i ~ N (0, ∑j) where ∑j is the qr x qr matrix of dispersion corresponding to the jth level of the between-subjects factor. Jointly,
where the symbol ![]() represents the direct or Kronecker product of two matrices. The fact that ∑j
depends upon i means that the covariance matrices for the repeated measures
vary across groups.
represents the direct or Kronecker product of two matrices. The fact that ∑j
depends upon i means that the covariance matrices for the repeated measures
vary across groups.
Multivariate Brown-Forsythe (BF) test
The general linear hypothesis for the BF procedure can be written as
![]()
where C’ is a vh x p matrix of rank nh, B was defined before, and A is a q x u matrix of rank u. Coefficients for between-subjects contrasts are contained in C and coefficients for within-subjects contrasts for the r dependent variables are contained in A.
The BF statistics for testing the hypothesis concerning to the within-subjects interaction, assuming (2), can be expressed in terms of the matrices H and E*. These matrices take the following form,
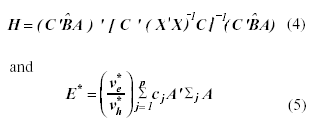
where C’ = [Ip-1 ≡ -1] and
A = Ir ![]() F, with F = [Iq-1 ≡ -1] and
cj = (1 - nj | N). This form
of E* matrix ensures that the expected values of H
and the expected value of
F, with F = [Iq-1 ≡ -1] and
cj = (1 - nj | N). This form
of E* matrix ensures that the expected values of H
and the expected value of ![]() are equal if the null hypothesis is true, since mean vectors are being compared
across groups.
are equal if the null hypothesis is true, since mean vectors are being compared
across groups.
Using results in Nel and van der Merwe (1986), the distribution
of matrix ![]() can
be approximated as a sum of Wisharts distribution
can
be approximated as a sum of Wisharts distribution
 (6)
(6)
with degrees of freedom
 (7)
(7)
The symbol tr denotes the trace of a matrix.
This hypothesis was tested using the F-test approximation to Wilk’s L given by Rao (1951) as
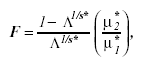 (8)
(8)
where s* = [(m2 µ *2h - 4) / (m2 + µ *2h - 5)]1/2, µ* 1 = mµ* h, µ* 2 = {[µ* e - (m - µ* h + 1) / 2] s* - (mµ* h -2) /2}, µ* h = µh. µ* h/(p-1), and Λ = |E*| | / | E* + H|, with m equal to the dimension of E* and H and µ*h equal to:
 (9)
(9)
where M=R(R’GR) + R’ and
P=diag [(n1/N)-1 ∑1,...,
(np/N)-1 ∑p], with R=C’
![]() (Ir
(Ir
![]() F’), G=
{ [ N-1(X’ X)]-1
F’), G=
{ [ N-1(X’ X)]-1 ![]() Λ },
Λ = diag (11, 02,..., 0qr), and (.)+ is the Moore-Penrose
inverse of (.). This hypothesis was rejected at nominal α level if F > F(1-α); µ1*, µ2*, where F(1 - α ); µ1*, µ2*, is the 100
(1-α) th percentile of the F-distribution with µ1* and µ2* degrees of freedom.
Λ },
Λ = diag (11, 02,..., 0qr), and (.)+ is the Moore-Penrose
inverse of (.). This hypothesis was rejected at nominal α level if F > F(1-α); µ1*, µ2*, where F(1 - α ); µ1*, µ2*, is the 100
(1-α) th percentile of the F-distribution with µ1* and µ2* degrees of freedom.
The above result was established assuming that the quadratic form H can be approximated as weighted sum of Wisharts distribution
Where each Wishart distribution in the sum has one degree of
freedom and λ1, λ2,..., λm
are distinct nonzero eigenvalues of MP (or PM). Taking ![]() Khatri (1980) find that
Khatri (1980) find that
E(H)= λj µj, (11)
and
V(H)= 2λ2j µj . (12)
Equating the first two moments of the distribution of H [E(H)=tr(MP) and V(H)=tr(MP)2] to those of a central Wishart matrix and solving simultaneously the equations (11) and (12) we obtained the equation (9).
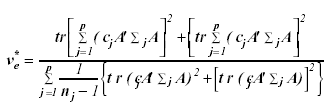
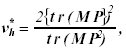
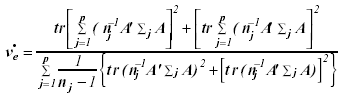
The statistics used to test the within-subjects main effect
hypothesis also can be expressed in terms of the matrices H and ![]() where
where
In equation (13), C’ is a 1 x p vector of ones,
A is as previously defined, and ![]() = (n / ñ)1/2
= (n / ñ)1/2 ![]() , where the symbols n and ñ designates the arithmetic mean and
the harmonic mean of nj’s, respectively. Extending the results
reported by Nel and van der Merwe (1986), the distribution of matrix
, where the symbols n and ñ designates the arithmetic mean and
the harmonic mean of nj’s, respectively. Extending the results
reported by Nel and van der Merwe (1986), the distribution of matrix ![]() can be approximated as a sum of Wisharts distribution
can be approximated as a sum of Wisharts distribution
 (15)
(15)
with degrees of freedom
 (16)
(16)
This hypothesis was tested using the F-test approximation to Wilk’s L given by Rao as
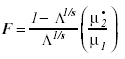 (17)
(17)
Where s= [(m2µ2h - 4) / (m2 + µ2h - 5)]1/2, µ1= mµh, and µ•2 = {[µ•e - (m - µh + 1) / 2]s - (mµh - 2) / 2}.
The Welch-James (WJ) test
The multivariate WJ statistic for testing repeated measures main and interaction effect hypotheses developed by Keselman et al. (1993) according to Johansen (1980), can be used when the covariance homogeneity assumption is not satisfied. The approximate degrees of freedom multivariate WJ type statistic is
![]()
Where y is a pqr x 1 vector with elements obtained
by stacking the mean of yj, R = C’ ![]() (Ir
(Ir ![]() F’)
is a contrast matrix whose order depends on the hypothesis tested, and P
is a block diagonal matrix of dimension pqr x pqr with the sample covariance
matrices weighted by n-1j in the main diagonal. This test
statistic, divided by a constant, c, can be approximate by an F distribution
with µ1 (rank of the R contrast matrix) and µ2= µ1(µ1
+ 2) /(3A). The constant c= µ1 +2A - 6A /(µ1 + 2), with
F’)
is a contrast matrix whose order depends on the hypothesis tested, and P
is a block diagonal matrix of dimension pqr x pqr with the sample covariance
matrices weighted by n-1j in the main diagonal. This test
statistic, divided by a constant, c, can be approximate by an F distribution
with µ1 (rank of the R contrast matrix) and µ2= µ1(µ1
+ 2) /(3A). The constant c= µ1 +2A - 6A /(µ1 + 2), with
![]() (19)
(19)
Where Q j is a block diagonal matrix of dimension pqr x pqr, with the jth block equal to a qr x qr identity matrix and zeroes elsewhere.
Vallejo and Escudero (1998) showed that for testing H0
: Rµ = 0, the form of the R matrix depends on the tested
effect. For the interaction, R = C’ ![]() (Ir
(Ir ![]() F’) where C’ is a (p - 1) x p coefficient matrix that determines
the elements of B include in the null hypothesis, F is a q
x (q - 1) coefficient matrix for testing hypothesis about the repeated measures
variable, and Ir is an r x r identity matrix. Whereas
for the within-subjects main effect (additive model and unweighted means), R
= c’
F’) where C’ is a (p - 1) x p coefficient matrix that determines
the elements of B include in the null hypothesis, F is a q
x (q - 1) coefficient matrix for testing hypothesis about the repeated measures
variable, and Ir is an r x r identity matrix. Whereas
for the within-subjects main effect (additive model and unweighted means), R
= c’ ![]() (Ir
(Ir
![]() F’)
where c’ is a 1 x p vector of ones, F is a q
x (q - 1) contrast matrix, and Ir is an r x r identity
matrix.
F’)
where c’ is a 1 x p vector of ones, F is a q
x (q - 1) contrast matrix, and Ir is an r x r identity
matrix.
For both effects the H0 : Rµ = 0, is rejected using a significance level of α if TWJ / c > F(1-α); µ1, µ2, where F(1-α); µ1, µ2 is the 100 (1-α) th percentile of the F-distribution with µ1 and µ2 degrees of freedom.
Method
A Monte Carlo simulation study was undertaken to evaluate the robustness of the BF and WJ statistics for testing within-subjects main and interaction effects. The design investigated herein had one between-subjects factor (p = 3), one within-subjects factor (q = 4), and three dependent variables (r = 3). Five variables were manipulated. These were: (a) total sample size (N), (b) nature of the pairing of unequal covariance matrices and group sizes, (c) types of population covariance structures, (e) degree of heterogeneity of the covariance matrices, and (e) types of distributions.
Based on the previous research findings, the first variable, N, was selected such that the ratio of N / r (q-1) was ranged from 8 to 16. Thus, for r (q-1) = 9, N = 72, 108, and 144. Though, unfortunately, the last value is not very frequent in the educational and psychological researches according to the survey conducted by Kowalchuk, Lix, and Keselman (1996), for comparison purposes we have adopted.
The second variable manipulated in the current investigation was pairing condition. Null, positive and negative pairing of group sizes and covariance matrices were investigated. A null pairing refers to the case in which matrices are heterogeneous but the design is balanced, that is, the size of the element values at the covariance matrices were not related with the group sizes because all groups had an equal size. A positive pairing referred to the case in which the largest nj was associated with the covariance matrix containing the largest element values; a negative pairing referred to the case in which the largest njwas associated with the covariance matrix containing the smallest element values. For positive a negative pairings, a moderate and substantial degree of group size inequality was investigated. The moderately unbalanced group sizes had a coefficient of sample size variation (∆) equal to .20, while the more disparate cases ∆ = .40, where
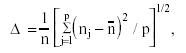 (20)
(20)
and n is the average group size. When the design is balanced ∆ = 0, whereas when the design is unbalanced this coefficient increase in value as group sizes become more disparate. Finally, the ratio of the smallest group size (e.g., nmin) to r (q - 1) were set at 1.33 for N = 72, 2 for N = 108, and 2.67 for N = 144.
The third variable investigated was the pattern of covariance
matrices. In this study, the forms of the dispersion matrices were ∑j=
(ψr ![]() Vj) and ∑j= (ψr
Vj) and ∑j= (ψr ![]() Wj), where ψr represents the r x r correlation
matrix for the dependent variables, and Vj and Wj
describes the covariance among the repeated measures associated with a particular
dependent variable. In the first condition the matrix Vj had
compound symmetry (CS), whereas in the second condition the matrix Wj
had serial correlation (AR). Though the BF and WJ procedures are
multivariate statistics and therefore should not be dependent of the pattern
of covariance matrices, Vallejo et al. (1999) found that the rate of
Type I error for the DMM test does vary with the form of ∑.
In particular, if the covariance matrix has a Kronecker structure.
Wj), where ψr represents the r x r correlation
matrix for the dependent variables, and Vj and Wj
describes the covariance among the repeated measures associated with a particular
dependent variable. In the first condition the matrix Vj had
compound symmetry (CS), whereas in the second condition the matrix Wj
had serial correlation (AR). Though the BF and WJ procedures are
multivariate statistics and therefore should not be dependent of the pattern
of covariance matrices, Vallejo et al. (1999) found that the rate of
Type I error for the DMM test does vary with the form of ∑.
In particular, if the covariance matrix has a Kronecker structure.
The fourth variable included in this study was the degree of heterogeneity of the covariance matrices. Two levels of dispersion matrix inequality were varied: (∑1= 1/3∑2 and ∑3 = 5/3∑2) and (∑1= 1/5∑2 and ∑3 = 9/5∑2).
The last variable investigated was the type of distribution. Type I error rates were obtained when the data were both normal and non-normal in form. With respect to the former condition, the data were generated as follows:
1. For each level of the between-subjects factor, generate vectors of pseudo-random normal variates. The GAUSS generator RNDN (GAUSS Aptech Systems, 1997) was used to obtain all vectors of normal variates.
2. The corresponding multivariate observations were obtained by the method of Schauer and Stoller (1966), that is, y’ij = Lzij + µij , where L is a Cholesky factor of ∑j and zijis a vector of normal variates obtained from the Kinderman and Ramage (1976) algorithm.
The non-normal data for the current study were sampled from a chi-squared distribution with three degrees of freedom as follows:
1. For each level of the between-subjects factor, to obtain each wij,, a vector of variates having a χ2 distribution with three degrees of freedom, three vectors of pseudorandom normal variates were squared and summed. The GAUSS generator RNDN (GAUSS Aptech Systems, 1997) was used to generate all variates.
2. The χ2 variates generated in the precedent step were standardized to have a mean zero and variance one using the population expected value and standard deviation. See Hasting and Peacock (1975) for further details on the generation of data from this distribution.
3. The corresponding multivariate observations were obtained using the same procedure as was used for the normal distribution.
This particular type of χ2(3) distribution with γ1 (skewness)=1.63 and γ2 (kurtosis)=4 was selected for three reasons. First, Micceri (1989) investigated many data sets from educational and psychological research and found striking departures from normality. Second, this population represent relatively extreme but realistic skew-leptokurtic distribution (see, Micceri, 1989, Wilcox, 1989). Third, this population has been used in a number of previous studies designed to investigate of the robustness of the WJ procedure (p.e., Keselman et al., 1993; Algina and Keselman, 1997).
The simulation program was written in the GAUSS programming language. All factors were completely crossed with one another: three sample sizes (72, 108, and 144), five patterns of pairings (one null, two positive, and two negative), two types of covariance structures, two levels of dispersion matrix inequality, and two types of distributions. For each of the 3 x 5 x 2 x 2 x 2 = 120 cells of the design the number of replications was 10,000. Using Wilk’s (1932) lambda, the BF and WJ statistics for testing hypothesis concerning main and interaction effects were performed using the 0.05 and 0.01 nominal significance level. A summary of conditions included in the study is presented in Table1.
Results
Estimated Type I error rates ( ![]() ) are reported in Table 2, in Table 3, in Table 4, and Table 5. On these tables,
) are reported in Table 2, in Table 3, in Table 4, and Table 5. On these tables,
![]() outside
the interval α/2 ≤
outside
the interval α/2 ≤ ![]() ≤ 3/2α are in bold. According to this criterion, in order for a
test to be considered robust, its empirical rate of Type I error must be contained
in the interval (.025 ≤
≤ 3/2α are in bold. According to this criterion, in order for a
test to be considered robust, its empirical rate of Type I error must be contained
in the interval (.025 ≤ ![]() ≤ .075) for the 5% level of significance, and in the interval (.005 ≤
≤ .075) for the 5% level of significance, and in the interval (.005 ≤
![]() ≤
.015) for the 1% level of significance. Correspondingly, a test was considered
to be non-robust if, for a particular condition, its Type I error was not contained
in these intervals. Although to evaluate the adequacy of robustness in control
of Type I errors, several standards have been used, Keselman and Lix (1997)
used this criterion and thus for comparison purposes we have adopted it as well.
Nonetheless, it should be noted that with other standards different interpretations
of the results are possible.
≤
.015) for the 1% level of significance. Correspondingly, a test was considered
to be non-robust if, for a particular condition, its Type I error was not contained
in these intervals. Although to evaluate the adequacy of robustness in control
of Type I errors, several standards have been used, Keselman and Lix (1997)
used this criterion and thus for comparison purposes we have adopted it as well.
Nonetheless, it should be noted that with other standards different interpretations
of the results are possible.
Type I Error Rates for Tests of the Occasions Main Effect
Normally Distributed Data.Table 2 contains the empirical rates of Type I error for the main effect of the BF and WJ tests for each manipulated condition.
As seen from table 2, the WJ statistic was able to control the Type I error rates across all of the investigated conditions, even when the sample sizes are small. Similar results were obtained with the BF procedure, except for negative pairing condition, when N = 72 and ∆ = .40. In this case, the procedure was always conservative. The other two manipulated conditions, that is, covariance ratios and pattern of covariance matrices had little effect on the results associated with both procedures.
Nonnormally Distributed Data. Table 3 contains the empirical rates of Type I error for the main effect when data were sampled from a chi-squared distribution with three degrees of freedom.
As seen from table 3, when the data are obtained from a skewed distribution increases Type I error rates for the BF and WJ tests, in particular, for α = .01. For the BF test 4 conditions resulted in Type I error rates below .005, and 16 rates above .015. Whereas, for the WJ test 23 conditions resulted in Type I error rates above .005, and 8 rates above .075.
In this case, contrary to what happened when data were sampled from a multivariate normal distribution, covariance ratios and pattern of covariance matrices had a superior effect on the robustness of both procedures; especially, the degree of heterogeneity of the covariance matrices.
Type I Error Rates for Tests of the Groups x Occasions Interaction Effect
Normally Distributed Data.Table 4 gives the empirical Type I error rates obtained in the simulation for the interaction effect when data were sampled from a multivariate normal distribution.
An inspection of the results in Table 4 indicates that, the BF statistic was able to control the Type I error rates across all of the investigated conditions, except for negative pairing condition, when N = 72, and ∆ = .40. In this case, the same as it happened for the main effect tests and normally distributed data; the procedure had a tendency to have Type I error rates below the lower limit of Bradley’s (1978) liberal criterion interval. However, the results in Table 4 show that the WJ procedure did not provide a robust test of the within-subjects interaction effect, given that exhibits poor control of the Type I error rates for many of the investigated conditions. A careful examination of the Table 4 reveals that, when there was an inverse relationship between sample sizes and dispersion matrices and ∆ = .40, the WJ procedure was always liberal and error rates were, in some cases, may become severely inflated. In fact, in Table 4, it is readily seen that while BF statistic was able to control the Type I error rates in 110 of the 120 investigated conditions the WJ test had a liberal behavior in more than half of the examined conditions. Consistent with the findings of other researches, including Keselman and Lix (1997), the degree of liberalness of the WJ test decreasing as the sample sizes increases.
Nonnormally Distributed Data. Table 5 contains the empirical rates of Type I error for the interaction effect when data were sampled from a chi-squared distribution with three degrees of freedom.
As seen from the table 5, when the multivariate normality assumption was violated, the pattern of results associated with the BF statistic was very similar to the one observed when the normality assumption was satisfied. For this procedure, the impact of non-normality on Type I error rates is modest. With respect to the WJ procedure, error rates associated with the skewed distribution were almost always larger than those obtained for the normal distribution; in particular, for α = .01. For positive pairings, Type I error rates associated with the skewed distribution were not always larger than those obtained for the normal distribution. However, for balanced designs and negative pairings, error rates associated with the skewed distribution were always larger than those obtained for the normal distribution. In fact, for the BF test 8 conditions resulted in Type I error rates below the lower limit of Bradley’s (1978) liberal criterion interval. Whereas, for the WJ test 85 conditions resulted in Type I error rates above upper limit of Bradley’s liberal criterion.
As was true for the main effect and skewed data, covariance ratios and pattern of covariance matrices had a superior effect on the robustness of both procedures; especially, the degree of heterogeneity of the covariance matrices.
Finally, Table 6 gives a summary of the number of empirical
Type I error rates above or below of interval α/2 ≤ ![]() ≤ 3/2α. Each below and above cell corresponds to 10 conditions because
the count is aggregated over the 2 alpha levels and 5 pairing conditions.
≤ 3/2α. Each below and above cell corresponds to 10 conditions because
the count is aggregated over the 2 alpha levels and 5 pairing conditions.
An inspection of the results in Table 6 indicates that, the BF statistic was able to control the Type I error rates in 432 of the 480 investigated conditions. In fact, for the BF test 28 conditions resulted in Type I error rates below the lower limit of Bradley’s liberal criterion and 20 above upper limit of Bradley’s liberal criterion. Whereas, for the WJ test 177 conditions resulted in Type I error rates above upper limit of Bradley’s liberal criterion.
Discussion and conclusions
The purpose of this investigation was to compare the performance of the modified BF approach presented by Vallejo et al. (in press) with the performance of Johansen’s (1980) solution, when testing within-subjects main and interaction effects in unbalanced multivariate split-plot designs. Specifically, we examined the robustness of these procedures when the homogeneity of the covariance matrices is not satisfied and data were obtained from the non-normal chi-squared distribution.
The results indicate that when covariance homogeneity assumption was violated, but the normality assumption is satisfied, both the BF and WJ test show a good control of Type I error rates across all of the investigated conditions for the within-subjects main effect. Although, for negative pairings and severe values of coefficient of sample size variation, the WJ test seems preferable as a test of the within-subjects main effect, because it is never too conservative neither excessively liberal test.
When normality and homogeneity assumptions are jointly violated, the WJ test does not perform as well with those sample sizes that can be considered the norm, rather than the exception in the psychological and educational researches (see Kowalchuk et al, 1997). In this case, at least for the conditions included in our study, the BF approach is preferable a test of the within-subjects main effect. However, it is important to remember that, for the no-normal data, none of the procedures was able to control the rates of Type I error in all of the investigated conditions.
With regard to the test of the interaction effect, our results indicate that the BF procedure can effectively control the rate of Type I errors when group variance-covariance matrices are heterogeneous, even when the data were sampled from a chi-squared distribution with three degrees of freedom. This finding held even when the degree of heterogeneity of the covariance matrices was varied across the design. As with the main effect, the procedure tends to be conservative for negative pairings and severe values of coefficient of sample size variation. On the other hand, our results also indicate that when the interest lies in the interaction, the WJ test is not a adequate solution, since the sample sizes required to achieve robustness could be unreasonably large, particularly when the multivariate normality assumption is violated. For very large sample sizes the procedure appear to be robust. Nevertheless, sample sizes superiors to 200 subjects could be required. Unfortunately, according to a survey conducted by Kowalchuk et al. (1996), these values are not frequent in the current educational and psychological investigation. This result is consistent with the findings of Algina and Keselman (1997) and Keselman and Lix (1997).
Consequently, because the WJ procedure require large sample sizes to obtain robust test of within-subjects effects in multivariate split-plot designs, in particular of the within-subjects interaction effects, when the multivariate normality and variance homogeneity assumptions are not satisfied, we recommended that researches use the BF procedure. In addition of the available results in Vallejo et al. (in press), this recommendation is based in that in a majority of the conditions used in the study the BF test was more robust than the WJ test. In short, the control of Type I error rates was achieved in 90 percent of the cases with BF test, and only in 63 percent of the cases with WJ test. Thus, in our opinion, applied researchers should be comfortable using the modified BF test to analyze multivariate repeated measures hypotheses when the assumptions of the general linear model are violated.
As final note, four lines of additional research can be of interest. First, it is very important to investigate whether the multivariate BF procedure offers robust tests when covariance matrices vary across groups but are not multiples of one another. Second, in the context of multivariate designs, it is not known whether the performance of the tests will change using trimmed means and Winsorized variances. However, the results obtained in the context univariate are encouraging (see, Wilcox, Keselman, Muska and Cribbie, 2000). Third, which of the robust procedures will be most sensitive for detecting treatment effects. Fourth, additional research manipulating other types of nonnormal distributions, both symmetric and asymmetric distributions with light tail and heavy tail, might also be investigated.
Acknowledgements
Esta investigación fue subvencionado por por una ayuda del Ministerio de Educación (DGICYT PS95-0228) y de la Universidad de Oviedo (IR99-0622).
Parte de los resultados del presente trabajo fueron presentados en el Sixth European Congress of Psychology, Julio de 1999, Roma.
Algina, J., & Keselman, H. J. (1997). Testing repeated measures hypotheses when covariance matrices are heterogeneous: Revisiting the robustness of the Welch-James test. Multivariate Behavioral Research, 32, 255-274.
Algina, J., & Oshima, T. C. (1995). An improved general approximation test for the main effect in a split-plot design. British Journal of Mathematical and Statistical Psychology, 48, 149-160.
Boik, R. J. (1991). Scheffé’s mixed model for multivariate repeated measures: A relative efficiency evaluation. Communication Statistics-Theory and Methods, 20, 1233-1255.
Bradley, J. V. (1978). Robustness? British Journal of Mathematical and Statistical Psychology, 31, 144-152.
Brown, M. B., & Forsythe, A. B. (1974). The small sample behavior of some statistics which test the equality of several means. Technometrics, 16, 129-132.
Davidson, M. L. (1972). Univariate versus multivariate test in repeated measures experiments. Psychological Bulletin, 77, 446-452.
GAUSS (1997). The Gauss System (Vers. 3.2.32). Washington: Aptech Systems, Inc.
Hastings, N. A. J., & Peacock, J. B. (1975). Statistical Distributions: A Handbook for Students and Practitioners. New York: John Wiley.
Huynh, H. (1978). Some approximate tests for repeated measurement designs. Psychometrika, 43, 161-165.
Johansen, S. (1980). The Welch-James approximation of the distribution of the residual sum of squares in weighted linear regression. Biometrika, 67, 85-92.
Jones, R. H. (1993). Longitudinal Data with Serial Correlation: A State-Space Approach. London: Chapman and Hall.
Keselman, H. J., Algina, J., Kowalchuk, R. K., & Wolfinger, R. D. (1999). A comparison of recent approaches to the analysis of repeated measurements. British Journal of Mathematical and Statistical Psychology, 52, 63-78.
Keselman, H. J., Carriere, M. C., & Lix, L. M. (1993). Testing repeated measures hypotheses when covariance matrices are heterogeneous. Journal of Educational Statistics, 18, 305-319.
Keselman, J. C., & Keselman, H. J. (1990). Analysing unbalanced repeated measures designs. British Journal of Mathematical and Statistical Psychology, 43, 265-282.
Keselman, H. J., & Lix, L. M. (1997). Analysing multivariate repeated measures designs when covariance matrices are heterogeneous. British Journal of Mathematical and Statistical Psychology, 50, 319-338.
Khatri, C. G. (1980). Quadratic forms in normal variables. In P. R. Krisnaiah (Ed.). Handbook of Statistics 1: Analysis of Variance. New York: North Holland Publishing Company.
Kinderman, A. J., & Ramage, J. G. (1976). Computer generation of normal random numbers. Journal of the American Statistical Association, 77, 893-896.
Kowalchuk, J. C., Lix, L. M., & Keselman, H. J. (1996). The analysis of repeated measures designs. Paper presented at the Annual Meeting of the Psychometric Society, Banff, Alberta.
Mehrotra, D. V. (1997). Improving the Brown-Forsythe solution to the generalized Behrens-Fisher problem. Communication in Statistics-Simulation and Computation, 26, 1139-1145.
Mendoza, J. H., Toothaker, L. E., & Nicewander, W. J. (1974). A Monte Carlo comparison of the univariate and multivariate methods for the groups by trials repeated measures design. Multivariate Behavioral Research, 9, 165-178.
Micceri, T. (1989). The unicorn, the normal curve, and other improbable creatures. Psychological Bulletin, 105, 156-166.
Nel, D. G. & van der Merwe, C. A. (1986). A solution to the multivariate Behrens-Fisher problem. Communications in Statistics-Theory and Methods, 15, 3719-3735.
Olson, C. L. (1974). Comparative robustness of six tests in multivariate analysis of variance. Journal of the American Statistical Association, 69, 894-908.
Rao, C. R. (1951). An asymptotic expansion of the distribution of Wilks’s criterion. Bulletin of the International Statistical Institute, 33, Part 2, 177-180.
Rogan, C. J., Keselman, H. J., & Mendoza, J. L. (1979). Analysis of repeated measurements. British Journal of Mathematical and Statistical Psychology, 32, 269-286.
Rubin, A. S. (1983). The use of weighted contrast in analysis of models with heterogeneity of variance. Proceedings of the Business and Economic Statistics Section, American Statistical Association, 347-352.
SAS Institute (1996). SAS/STAT Software: Changes and Enhancements through Release 6.11. Cary, NC: SAS Institute Inc., charter, 18.
Scheffé, H. (1956). A mixed model for the analysis of variance. Annals of Mathematical Statistics, 27, 23-36.
Shoukri, M. M., & Pause, C. A. (1999). Statistical Methods for Health Sciences (2nd ed.). New York: CRC Press.
Schuer, E. M., & Stoller, D. S. (1966). On the generation of normal random vectors. Technometrics, 4, 278-280.
Vallejo, G., & Menéndez, I. A. (1997). Una comparación de enfoques alternativos para el análisis de diseños multivariados de medidas repetidas. Psicothema, 9, 647-656.
Vallejo, G., & Escudero, J. R. (1998). Algunas soluciones aproximadas para diseños split-plot con matrices de covarianza arbitrarias. Qüestiió: Quaderns d’Estadística i Investigació Operativa,22, 463-468.
Vallejo, G., Fernández, P., Fidalgo, A. M., & Escudero, J. R. (1999). Comparación de la robustez de cuatro pruebas en un diseño multivariado split-plot. Metodología de Investigación de las Ciencias del Comportamiento, 1, 1-23.
Vallejo, G., Fidalgo, A. M., & Fernández, P. (1998). Efectos de la no esfericidad en el análisis de diseños multivariados de medidas repetidas. Anales de Psicología, 14, 249-268.
Vallejo, G., Fidalgo, A. M., & Fernández, P. (in press). Effects of covariance heterogeneity on three procedures for analysing multivariate repeated measures designs. Multivariate Behavioral Research.
Wilcox, R. R. (1989). Adjusting for unequal variances when comparing means in one-way and two-way fixed effects ANOVA models. Journal of Educational Statistics, 14, 269-278.
Wilcox, R. R., Keselman, H. J., Muska, J., & Cribbie, R. (2000). Repeated measures ANOVA: Some new results on comparing trimmed means and means. British Journal of Mathematical and Statistical Psychology, 53, 69-82.
Wilks, S. (1932). Certain generalizations in the analysis of variance. Biometrika, 24, 471-494.
Aceptado el 20 de junio de 2000