Psicothema was founded in Asturias (northern Spain) in 1989, and is published jointly by the Psychology Faculty of the University of Oviedo and the Psychological Association of the Principality of Asturias (Colegio Oficial de Psicología del Principado de Asturias).
We currently publish four issues per year, which accounts for some 100 articles annually. We admit work from both the basic and applied research fields, and from all areas of Psychology, all manuscripts being anonymously reviewed prior to publication.

Psicothema, 1994. Vol. Vol. 6 (nº 2). 297-310
Alberto Maydeu-Olivares
University of Illinois
Latent trait models (LTMs) are one type of individual differences scaling models. Most commonly, these models use parametric functions to model the option response functions (ORFs) and latent trait distributions, although recently several nonparametric LTMs have also been proposed. In this paper, the strengths of each of these two approaches are discussed by comparing two models: Muthén's parametric LISCOMP model, and Levine's nonparametric MFS model. It was found that the MFS model is particularly suited for unidimensional scaling since it allows density estimation, it is more flexible at modeling the shape of the ORFs, and therefore may be more robust to mispecifications of the dimensionality of the data. The LISCOMP model, on the other hand, is particularly suited for multidimensional scaling, and for modeling the relationships between the scaling dimensions and external variables. Nonparametric models such as MFS are not easily generalized to multidimensional situations since they usually rely on smoothing constraints to reduce the estimation parameter space. These constraints are based on assumptions about the functional form of the ORFs and the latent trait densities, and it may be difficult to arrive at a set of constraints that will prove appropriate for different sampling schemes and dimensionality hypotheses.
Key words: IRT; item response theory.
Enfoques parametricos versus no parametricos para el escalamiento de diferencias individuales. Los modelos de rasgos latentes (MRLs) son un tipo de modelos de escalamiento de diferencias individuales. Habitualmente, estos modelos utilizan funciones paramétricas para modelar las funciones de respuesta a las opciones (FROs) y las distribuciones de los rasgos latentes, aunque recientemente varios MRLs no paramétricos han sido propuestos. En este artículo se comparan las ventajas de cada uno de estos dos enfoques mediante la comparación de dos modelos: el modelo paramétrico LISCOMP de Muthén, y el modelo no paramétrico MFS de Levine. El modelo MFS es particularmente apropiado en escalamiento unidimensional dado que permite estimar la densidad del rasgo latente, es m.s flexible para modelar las FROs, y como resultado puede ser m.s robusto a mis especificaciones de la dimensionalidad de los datos. El modelo LISCOMP, por su parte, es particularmente apropiado en escalamiento multidimensional, así como para modelar las relaciones entre las dimensiones del escalamiento y variables externas. Los modelos no paramétricos como MFS no son generalizables fácilmente a situaciones multidimensionales ya que habitualmente utilizan restricciones que suavizan la forma de las funciones utilizadas. Estas restricciones se basan en supuestos acerca de las formas de las FROs y de las densidades de los rasgos latentes. Sin embargo, puede ser difícil el llegar a establecer un conjunto de restricciones común para diferentes diseños muestrales y para diferentes soluciones dimensionales.
Palabras clave: TRI; teoría de respuesta a los items.

One of the main objectives of Psychology as a Science is to study how we represent our perceptions of stimuli. Different sampling as a Science is to study how we represent our designs can be used in this endeavor: paired comparisons, sorting tasks, etc. For simplicity, this article focuses on one of the most common sampling designs: the direct response design. In this sampling design, which is widely used when the stimuli to be scaled are statements reflecting values or attitudes, or containing behavioral or cognitive descriptions, each subject is presented every stimulus one at a time. A forced choice categorical response format (dichotomous or polychotomous) is commonly presented to the subjects when this type of stimuli are used. In a dichotomous response format the subject might be asked, for instance: (a) to endorse or reject a statement that reflects his/her attitudes, or (2) to check a psychological symptom as present or absent. In a polychotomous response format the subject might be asked, for instance: (a) to endorse an attitudinal statement in a rating scale ranging from strongly disagree to strongly agree, or (b) to rate the occurrence of a behavior from very infrequent to very frequent. In this context, scaling can be defined as the mapping of all respondents and stimuli in a continuum, based on the subjects' categorical responses.
One approach to scaling consists of assuming that all subjects perceive the stimuli in the same way. When this assumption is adequate, we can readily rank order our stimuli along a continuum using appropriate models (e.g., Thurstone, 1927; Coombs, 1950; Bradley & Terry, 1952; Luce, 1959). Alternatively, we may assume that within a homogeneous set of stimuli there are no inter-stimuli differences, and that the observed variability in how subjects respond to stimuli is solely due to systematic individual differences. When this assumption is adequate, the subjects can be rank ordered along a continuum. An example of this approach is given by Likert (1932).
However, it seems more reasonable to believe that the observed variability in the subjects' responses is due to systematic individual differences and to inter-stimuli differences. In that case, it is necessary to find a way to separate the within-individual variability from the between-individual variability. One way to account for the dependencies among observations due to the between-subject variation is to use a statistical model that includes subject parameters along with stimuli parameters. These parameters can then be estimated by asymptotically optimal estimation methods such as maximum likelihood or generalized least squares. Unfortunately, because the subject parameters increase as sample size increases, the desirable asymptotic properties of those estimators do not hold (Neyman & Scott, 1948). One way of solving this problem is to introduce the subject parameters as a random effect, while keeping the stimuli parameters as a fixed effect.
Generally speaking, the probability of observing a vector of categorical responses υ = u can be expressed as
(1) Prob (υ = u) = ƒ Prob (υ = u Ι θ = t) f ( t ) d ( t )
where f ( t ) is the probability density function of the subject parameters and Prob ( υ = u Ι θ = t ) is the probability of observing a response vector υ = u in a group of subjects with a fixed value, θ = t, in the continuum of subject parameters.
This paper focuses in a subset of the individual differences scaling models, namely, in those models where the Prob (υ = u Ι θ = t ) can be represented as
(2) Prob (υ = u Ι θ = t) = Π Prob (υt = ui Ι θ = t)
where θ is a q dimensional vector of subject parameters. These models are generally called latent trait models, and, the random variables θ (theta) are called latent traits. These models have been most commonly used to scale direct response data, although they may also well be used to scale data obtained through other sampling designs (see Takane, 1989).
Note that of the three terms appearing in Equation 1, { Prob ( υ = u ), Prob (υ = u Ι θ = t ), and f( t ) }, generally only one, Prob (υ = u), may be estimated directly and that Prob (υ = u Ι θ = t ) and f( t ) can not be estimated simultaneously (see Bartholomew, 1987). In any case, it is possible to:
(1) Estimate the function Prob(υ = u Ι θ= t ) if f ( t ) is known (or assumed to be known);
(2) Estimate the density f (t) if the function Prob (υ = u Ι θ= t ) is known (or assumed to be known); or
(3) Estimate Prob (υ = u Ι θ = t ) and f (t) alternatively. For instance, a) assigning an initial value to f (t) to estimate Prob (υ = u Ι θ = t), b) re-estimating f (t) using the Prob (υ = u Ι θ = t) estimated previously, and so on until the algorithm converges.
Most latent trait models specify an a priori parametric form for Prob (υ = u Ι θ = t), usually a cumulative normal or logistic function, and a parametric function for f (t), usually a normal density. Recently, however, several non parametric latent trait models have been proposed (Ramsey, 1988; Ramsey & Winsberg, 1991; Samejima, 1983, 1988; Levine, 1984; Levine, Drasgow, Williams, Maydeu-Olivares, Mead, Thomasson, Tsien. Wei, & Zickar, 1993). In this paper these two approaches will be compared. With this aim, I will describe with some detail (1) a parametric model of individual differences scaling, proposed by Muthén (1983, 1984, 1987), and (2) a non parametric model of individual differences scaling, proposed by Levine (1984, 1989; Levine et al., 1993; Williams & Levine, 1993). To illustrate the exposition, an application of these two approaches to a set of actual data will be presented.
PARAMETRIC VS. NON PARAMETRIC LATENT TRAIT MODELS
In his pioneering work on scaling, Thurstone was already concerned with the sampling theory foundations of his model. In fact, Thurstone (1927) introduced two explanations for the nature of the stochasticity of what he referred to as ‘discriminal processes' of the subjects. These are the Case I and Case II of this Law of Comparative Judgment. Interestingly enough, Thurstone's case I and Case II closely match the stochastic subject rationale and the random sampling rationale for latent trait models described by Holland (1990).
Indeed, Holland (1990) has argued that when the data is collected using a direct response sampling design and fitted by a latent trait model, the basis for statistical inference lies in what he refers to as a random sampling rationale. According to this rationale, the meaningfulness of statistical inference in latent trait models is granted by assuming that: 1) the stimuli are fixed in the sense of not being sampled, and 2) the subjects are a random sample from a population. Furthermore, Holland (1990: p. 584) states «I believe that no completely satisfactory justification of the stochastic subject is possible».
If, following Holland (1990), we accept that statistical inference in latent trait models only requires these two assumptions, then any function can be used to represent Prob (υ = u Ι θ = t) and f (t) provided that Equation 2 is satisfied. That is, the density f(t) is only determined up to a choice of the function Prob (υ = u Ι θ = t), and vice versa.
The random sampling rationale also has implications for estimation. If the categorical responses to be scaled are obtained from a random sample of subjects from a much larger population, then the maximum likelihood estimator of the log-likelihood of the data is exactly the so called ‘marginal' maximum estimator (MMLE) applied by Bock and Aitkin (1981) to parametric models and by Levine (1989) to nonparametric models (see Holland, 1990: p. 593).
LISCOMP: A parametric model of individual differences scaling by covariance structure analysis
Takane and de Leeuw (1987) and Takane (1989) have shown that many scaling models (e.g. Thurstone, 1927, 1959; Takane, 1980; Heiser & de Leeuw, 1981; De Soete & Carroll, 1983; De Soete, Carroll & DeSarbo, 1986) can be considered as special cases of analysis of covariance structures (ACOVS: Jöreskog, 1970). In particular, Takane and de Leeuw (1987) have shown that most parametric latent trait models for direct response data (e.g. Samejima, 1969; Bock, 1972; Muthén, 1984) are special cases of covariance structures analysis, or more generally, of moment structures analysis, and therefore suitable to be estimated using existing covariance structures software such as LISCOMP (Muthén, 1987) or LISREL 7 (Jöreskog & Sörbom, 1989).
Muthén (1983, 1984, 1987) has described a covariance structures model given by
(3) y = υ + Λ θ + ε
(4) θ = α + Bθ + ζ
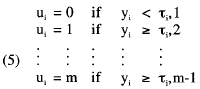
where θ is a vector of individual differences parameters (latent traits); Λ and B are matrices of structural and measurement regression coefficients, respectively; ζ and ε are vectors of structural and measurement residuals, respectively; and α and υ are vectors of structural and measurement intercepts, respectively. Categorical ratings, ui = 1, 2, ..., k, ..., m, obtained by a direct response design can be incorporated into the model by assuming that the y variables in Equation 3 have been categorized by
If, in addition, it is assumed that the y and θ variables follow a multinormal distribution we have
![]() (6)
(6)
where the τ variables are thresholds, and F(•) is a normal cumulative function. Muthén's (1983, 1984) model is formally equivalent (in the unidimensional case) to Samejima's (1969) graded model (see Takane & de Leeuw, 1987), and is directly related to Thurstonian scaling models (see Thurstone, 1959).
Muthén (1984, 1987) has proposed a thee-stage limited information estimator of this model that uses only first and second moments of the data. The resulting weighted least squares loss function is asymptotically distributed as chi-square with n(n+1)/2-p degrees of freedom, where p is the number of stimuli parameters in the model, and n is the number of stimuli to be analyzed. This weighted least squares estimator must be regarded as an approximation to the MMLE estimator described by Bock and Aitkin (1981).
MFS. A non parametric model of individual differences scaling
There are several non-parametric models of individual differences scaling (see Levine et al., 1993). In this paper, we will describe only one of them, Levine's Multilinear Formula Score model (MFS: Levine, 1984, 1989; Levine et al., 1993). The theoretical base of MFS lies on the finiteness of the span of the posterior densities of the subject parameters (see Levine, 1984, 1992). Since there are finitely many posterior densities, their linear span forms a finite dimensional vector space. The function corresponding to any single Prob (ui = k Ι θ=t) is then represented as a linear combination of a set of basis functions for that span, that is
![]()
where hj (t), j = 1, ..., J is an orthogonal basis function for the span of the posterior densities of the subject parameters, and a j,i,k is its corresponding coefficient estimated from the data. Thus, the sample likelihood of Prob (ui=k Ι θ = t) is evaluated as a function for the unknown coefficients aj,i,k. The orthogonal basis hj (t) are obtained by a procedure analogous to principal components performed on the span of the posterior densities of the subject parameters (Levine, 1989).
Levine et al. (1993) have pointed out that the fundamental feature that distinguishes non parametric from parametric models is that parametric models use only one function to fit the whole continuum of subject parameters (the latent trait), whereas non parametric models use an strategy to divide that continuum into small regions, and then use different functions to model each one of these subdivisions.
It is also noteworthy to point out that the LISCOMP model uses the first of the estimation strategies for latent trait models described previously. That is, the f(t) and Prob( ui = k Ι θ = t ) in this model are estimated by assuming that f(t) is a multivariate normal distribution, and that Prob (ui= k Ι θ = t) is a normal cumulative function.
The MFS model uses the third of such estimation strategies: Initial values of Prob (ui = k Ι θ = t) are used to estimate by marginal maximum likelihood f(t). Then, a set of orthonormal bases for f(t) is obtained, hj (t), and the coefficients aj,i,k in Equation 7 are estimated also by marginal maximum likelihood, completing an estimation cycle. Finally, to improve efficiency of the estimation, constraints are introduced over specified regions of h based on assumptions about the shapes of the functions Prob (ui = k Ι θ= t). These constraints reduce the parameter space by imposing linear inequalities that the vector of coefficients aj,i,k must satisfy. Three types of constraints are generally imposed: monotonicity constraints, concavity constraints, and smoothing constraints. Further details can be found in Levine (1984, 1989, 1992).
Any function Prob (ui= k Ι θ = t) may be used as starting values of the estimation process. For instance, a regression of each of the stimuli on some sort of total score of the stimuli can be used as starting values for MFS. These so-called item-score regressions are obtained using Sympson's (1988) POLYSCORE procedure. In this paper we used the functions Prob (ui= k Ι θ = t) estimated by LISCOMP as starting values for the program FORSCORE (Williams & Levine, 1993) to show how MFS is able to depart from a good starting value.
An example
The five statements that compose the Positive Problem Orientation (PPO) of the Social Problem Solving Inventory -Revised (SPSI-R: D'Zurilla & Maydeu-Olivares, 1993) were scaled using Muthén's (1984) parametric model, and Levine's (1984) non parametric model using the responses of 1053 subjects. Each of the subjects was asked to rate on a five point scale from ‘very true of me' to ‘not at all true of me' the accuracy of each of these five statements in relation to their overall daily behavior and cognitions in real life problem solving. These statements include behaviors that reflect a positive problem appraisal, commitment to a problem-solving coping strategy, problem solving self-efficacy self-expectancies, and positive outcome expectancies when facing real-life problems.
Muthén's (1984) version of Thurstonian scaling was fitted by weighted least squares using LISCOMP (Muthén, 1987). This model did not fit the data very well as assessed by the chi-square goodness-of-fit index χ2 (5) = 25.07, p < .001. However, the robustness of this test statistic to violations of the model assumptions when the response variables are categorical have not been extensively studied. Other goodness of fit indices reveal a reasonable good fit of this model: root mean square residual (RMSR)=.034, Tanaka and Huba's (1985) goodness of fit index (GFI)=.994, McDonald's (1988) mk=.991.
The non parametric model MFS was fitted to these data using the FORSCORE (Williams & Levine, 1993) computer program with 20 estimation cycles. We used as starting values the functions Prob (ui= k Ι θ= t) estimated by LISCOMP instead of the POLYSCORE curves to show how MFS is able to depart from a good parametric starting value.
The marginal maximum likelihood estimation method used by this program leads to a discrepancy function that is asymptotically distributed as chi-square with (mn-p) degrees of freedom, where m is the number of response options to each of the stimuli, n is the number of stimuli, and p is the number of stimuli parameters. This discrepancy function is based on the ratio of the likelihood under the fitted model to the likelihood of a saturated model in which we fit the multinomial distribution to the empirical frequencies (see McDonald & Mok, 1993). This statistic can hardly ever be used in practice, since often there are not enough data to estimate the empirical frequencies of all possible mn response patterns. In our example, there are 55=3125 possible response patterns, whereas only 1053 subject responses are available. Therefore, we are clearly unable to estimate the empirical frequencies of all possible response patterns.
Drasgow, Levine, Tsien, Williams, and Mead (in press) have suggested assessing the goodness of fit of these models by inspecting all first order, second order, and third order chi-square statistics of the mn table, instead of inspecting the overall mn table, because the empirical frequencies of these lower order statistics can be readily be estimated.
A chi-square statistic for a single stimulus is obtained by
![]() (8)
(8)
where the expected proportions are obtained from
![]() (9)
(9)
The chi-square statistics for a pair of stimuli (i,j) are obtained as in Equation 8, but the sum is over pairs of options (k, k') and the expected proportions are obtained by
![]() (10)
(10)
The chi-square statistics for a triplet of stimuli are obtained by the obvious extension of the above procedure (for more details see Drasgow et al., in press).
Since in practice sometimes some of the options are not chosen
by any subject in the sample, these chi-square statistics may have different
degrees of freedom. For this reason, Drasgow et al. (in press) recommend
inspecting the ratio chi-square to degrees of freedom to assess the goodness
of fit of the model. In Table 1 I present the results obtained by fitting the
LISCOMP and MFS models to the data of this example. As it can be observed in
this table, all chi-square to degrees of freedom ratios for the MFS model are
less than one, whereas only the chi-square/d.f. ratios for single stimuli are
less than one in the LISCOMP model. Furthermore, the mean of the ratios obtained
from single stimuli for the LISCOMP model (![]() = .00515) is less than the one obtained for the MFS model (
= .00515) is less than the one obtained for the MFS model (![]() = .10756). Thus, LISCOMP fits the first order marginals of these data better
than MFS, but MFS provides a better overall fit to the data.
= .10756). Thus, LISCOMP fits the first order marginals of these data better
than MFS, but MFS provides a better overall fit to the data.
That LISCOMP fits better than MFS the first order marginals can also be observed graphically by plotting the estimated functions Prob (ui= k Ι θ = t). In Figures 1 to 4 I present plots of these functions for the worse fitted stimulus (Figures 1 and 2) and better fitted stimulus (Figures 3 and 4). The vertical lines drawn in these figures correspond to 95% confidence intervals computed around 25 points in the θ scale (further details on the construction of these plots can be found in Drasgow et al., in press).
Those points where vertical lines have not been drawn indicate that less than five subjects chose that particular option, and therefore, confidence intervals around that point were not computed. In Figures 2 and 4 (corresponding to the MFS model), the estimated density has been transformed to a standard normal density so as to be able to compare these figures with those corresponding to the LISCOMP model.
The inspection of these figures reveals that both models fit these data satisfactorily. Note, however, that even after transforming its density, the MFS curves do not resemble the smoother LISCOMP curves. Levine et al. (1993) have performed several simulation studies that indicate that the somehow strange forms of the Prob (ui= k Ι θ =t) functions estimated by MFS are not due to sampling variations, but are due to the existence of multidimensionality or nonnormal densities in the data. It is precisely the higher flexibility of MFS to capture small degrees of multidimensionality and to model non normal densities which allows this model to fit the data of this example better than the LISCOMP model. In Figure 5, I present a plot of the density of the latent trait as estimated by MFS. As it can be observed in this figure, the estimated density is slightly bimodal and most subjects in this sample lie between -1 < θ < 1 . The elevations of the density at the extremes of the graph (θ ≥ Ι 2 Ι ) are due to the lack of subjects in the extremes of the distribution, and can be removed by imposing stricter smoothing constrains in the tails of the distribution.
CONCLUSIONS
A large set of scaling models hypothesize that the variability with which subjects perceive, discriminate, and choose among stimuli is due to both inter-individual variability and within-individual variability. These models, referred to as individual differences scaling models, generally use subject as well as stimuli parameters. A subset of the individual differences scaling models are the so-called latent trait models. An examination of the basis for statistical inference of latent trait models reveals that there is no need to postulate any particular functional form for the probability of discriminating or choosing a particular object given a fixed level of the continuum being measured. Thus, the use of nonparametric or semi-parametric latent trait models is fully justifiable. Indeed, in applications (as in the example presented in this paper) non-parametric latent trait models can offer a better fit than parametric latent trait models because.
a) they may be more robust than parametric models to mispecifications of the dimensionality of the data,
b) they are more flexible to model the probability of discriminating or choosing an stimulus,
c) they allow us to estimate a non parametric density of the subject parameters.
A major drawback of these models is that they rely on smoothing constraints to reduce the parameter space of estimation. These constraints are based on assumptions about the functional form of the probability of discriminating or choosing an stimulus given a fixed level of the scaling continuum. However, if these type of models are to be used in multidimensional situations, or with different sampling designs, then it will be necessary to modify the set of smoothing constraints, and it may be difficult to arrive at a set of constraints that will prove appropriate for each of these situations.
Under these conditions, parametric models of individual differences scaling, and more specifically, covariance structures models are superior to non parametric models. In particular, covariance structure models are clearly suited when it is of interest to model the relationships between a set of stimuli and some external variables.
AUTHOR NOTES
This research was made possible in part by Contracts No. N00014-89-K-059 and N0001490-J-1958 from the Office of Naval Technology, and by Office of Naval Research Contracts No. N00014-86K-0482, NR 442-1546, Michael Levine, principal investigator. The author's participation was supported by a Postdoctoral Scholarship from the Ministry of Education and Science of Spain (‘Beca Postdoctoral de Formación de Personal Investigador en el Extranjero'). The author is grateful to Michael Levine and especially to Ulf Böckenholt for their comments to a previous draft of this paper.
REFERENCES
Bartholomew, D. J. (1987). Latent variable models and factor analysis. New York: Oxford University Press.
Bradley, R. A., & Terry, M. E. (1952). The rank analysis of incomplete block designs. I. The method of paired comparisons. Biometrika, 39, 324-345.
Bock, R. D. (1972). Estimating item parameters and latent ability when the responses are scored in two or more nominal categories. Psychometrika, 37, 29-51.
Bock, R. D., & Aitkin, M. (1981). Marginal maximum likelihood estimation of item parameters: Application of an EM algorithm. Psychometrika, 46, 443-459.
Coombs, C. H. (1950). Psychological scaling without a unit of measurement. Psychological Review, 57, 145-158.
De Soete, G., & Carroll, J. D. (1983). A maximum likelihood method for fitting the wandering vector model. Psychometrika, 48. 553-566.
De Soete, G., Carroll, J. D., & DeSarbo, W. S. (1986). The wandering ideal point model: A probabilistic multidimensional unfolding model for paired comparison data. Journal of Mathematical Psychology, 30, 28-41.
Drasgow, F., Levine, M. V., Tsien, S., Williams, B., & Mead, A. D. (in press). Fitting polychotomous item response theory models to multiple-choice tests. Applied Psychological Measurement.
D'Zurilla, T. J., & Maydeu-Olivares, A. (1993). A revision of the Social Problem-Solving Inventory based on factor-analytic methods: An integration of theory and data. Manuscript submitted for publication.
Heiser, W., & de Leeuw, J. (1981). Multidimensional mapping of preference data. Mathématiques et Sciences Humaines, 19, 39-96.
Holland, P. W. (1990). On the sample theory foundations of itero response theory models. Psychometrika, 55, 577-601.
Jöreskog, K. G. (1970). A general model for the analysis of covariance structures. Biometrika, 57, 239-251.
Jöreskog, K. G., & Sórbom, D. (1989). LISREL 7. A guide to the program and applications. Chicago, IL: SPSS Inc.
Levine, M. V. (1984). An introduction to multilinear formula score theory. Champaign, IL: University of Illinois, Model Based Measurement Laboratory.
Levine, M. V. (1989). Ability distributions, pattern probabilistes and quasidensities. Champaign, IL: University of Illinois, Model Based Measurement Laboratory.
Levine, M. V. (1992). Orthogonal functions and the finiteness of continuous item response theories. Manuscript submitted for publication.
Levine, M.V., Drasgow. F., Williams, B., Maydeu-Olivares, A., Mead, A. D., Thomasson, G. L., Tsien, S., Wei, B., & Zickar, M. (1993). Polychotomous Measurement. (Final Report to the Office of Naval Technology Contract No. N00014-89-K-059). Champaign, IL: University of Illinois, Dept. of Educational Psychology, Model Based Measurement Laboratory.
Likert, R. (1932). A technique for the measurement of attitudes. Archives of Psychology, No. 140.
Luce, R. D. (1959). Individual choice behavior: A theoretical analysis New York: Wiley.
McDonald, R. P. (1988). An index of goodness-of-fit based on noncentrality. Journal of Classification, 6, 97-103.
McDonald, R. P., & Mok, M. C. (1993). Goodness of fit in item response models. Manuscript submitted for publication.
Muthén. B. (1983). Latent variable structural modeling with categorical data. Journal of Econometrics, 22, 43-65.
Muthén, B. (1984). A general structural equation model with dichotomous, ordered categorical, and continuous latent variable indicators. Psychometrika, 49, 115-132.
Muthén, B. (1987). LISCOMP: Analysis of linear structural equations using a comprehensive measurement model. Mooresville, IN: Scientific Software.
Neyman, J., & Scott, E. L. (1948). Consistent estimates based on partially consistent observations. Econometrika, 16, 1-32.
Ramsey, J. O. (1988). Monotone regression splines in action (with discussion). Statistical Science, 3, 425-461.
Ramsey, J. O., & Winsberg, S. (1991). Maximum marginal likelihood estimation for semiparametric item analysis. Psychometrika, 56, 35379.
Samejima, F. (1969). Calibration of latent ability using a response pattern of graded scores. Psychometrika Monograph Supplement, No. 17.
Samejima, F. (1983). Some methods and approaches of estimating the operation characteristics of discrete item responses. In H. Wainer and S. Messick [Eds.] Principals of modern psychological measurement: A Festschrift for Frederic M. Lord. Hillsdale, NJ: Lawrence Erlbaum.
Samejima, F. (1988). Advancement of latent trait theory. (Final Report of N00014-81-C-0569). Washington, DC: Office of Naval Research.
Sympson, J. B. (1988). A procedure for linear polychotomous scoring of test items. Paper presented at the 1988 Office of Naval Research Contractors' Meeting on Model-Based Psychological Measurement, Iowa City, Iowa.
Takane, Y. (1980). Maximum likelihood estimation in the generalized case of Thurstone's model of comparative judgement. Japanese Psychological Research. 22. 188-196.
Takane, Y. (1989). Analysis of covariance structures and probabilistic binary choice data. In G. De Soete, H. Feger and K.C. Klauer [Eds.] New developments in psychological choice modeling. Elsevier Science.
Takane, Y., & de Leeuw, J. (1987). On the relationship between item response theory and factor analysis of discretized variables. Psychometrika, 52, 393-408.
Tanaka, J. S., & Huba, G. J. (1985). A fit index for covariance structure models under arbitrary GLS estimation. British Journal of Mathematical and Statistical Psychology, 38, 197-201.
Thurstone, L. L. (1927). A law of comparative judgement. Psychological Review, 79, 281-299.
Thurstone, L. L. (1959). The measurement of values. Chicago, IL: University of Chicago Press.
Williams, B., & Levine, M. V. (1993). FORSCORE: A competer program for nonparametric item response theory. In preparation.
Aceptado el 27 de diciembre de 1993